Generating a Heat Map Using iBeacons with an Android Application
Introduction
About a month ago, I had the opportunity to experiment with iBeacons on the Android platform. My initial task was to implement a proximity trigger for one of our Android apps at work. As we delved deeper into the project, we became curious about obtaining more precise data, such as generating a heat map.
Searching for Solutions
I began by searching for existing projects and apps that could generate a heat map based on actual distances from iBeacons. Unfortunately, I couldn’t find a precise solution in the Play Store. After visualizing the raw accuracy data on a graph (as shown in the image below), I discovered a helpful page that confirmed some of my findings. Here are my key observations:
- The raw data from iBeacons is not as accurate as I initially expected.
- Accuracy varies depending on the orientation of the iBeacon relative to the smartphone.
- Beyond a certain distance, the margin of error increases significantly.
- For more precise data, you need to set the transmit interval and transmit power to their maximum values, but that also leads to more battery consumption.
What I Did
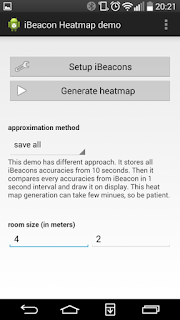
To address these challenges, I developed an Android app designed to generate a real-time heat map. Given the accuracy limitations of iBeacons, I consider this a beta demo of an iBeacon heat map. The app allows users to assign colors to different iBeacons, set room dimensions, and choose from a few approximation methods. While the results are still not as accurate as I’d like, the simplest method—averaging the last 30 values—has produced the most acceptable results so far.
Technical Details
For this project, I used IBKS 105 iBeacons from the Spanish vendor Accent Systems, with both the TX power and transmit interval set to their maximum available values. The app uses the Bluetooth address as a unique identifier, eliminating the need to set UUID, major, or minor values.
Github: https://github.com/svab-m/ibeacon_heatmap_demo
Google Play: https://play.google.com/store/apps/details?id=sk.svb.ibeacon.heatmap


Comments
Post a Comment